CASE STUDIES
The ₹30,000 Crore Momo Economy How Momos Entered India?
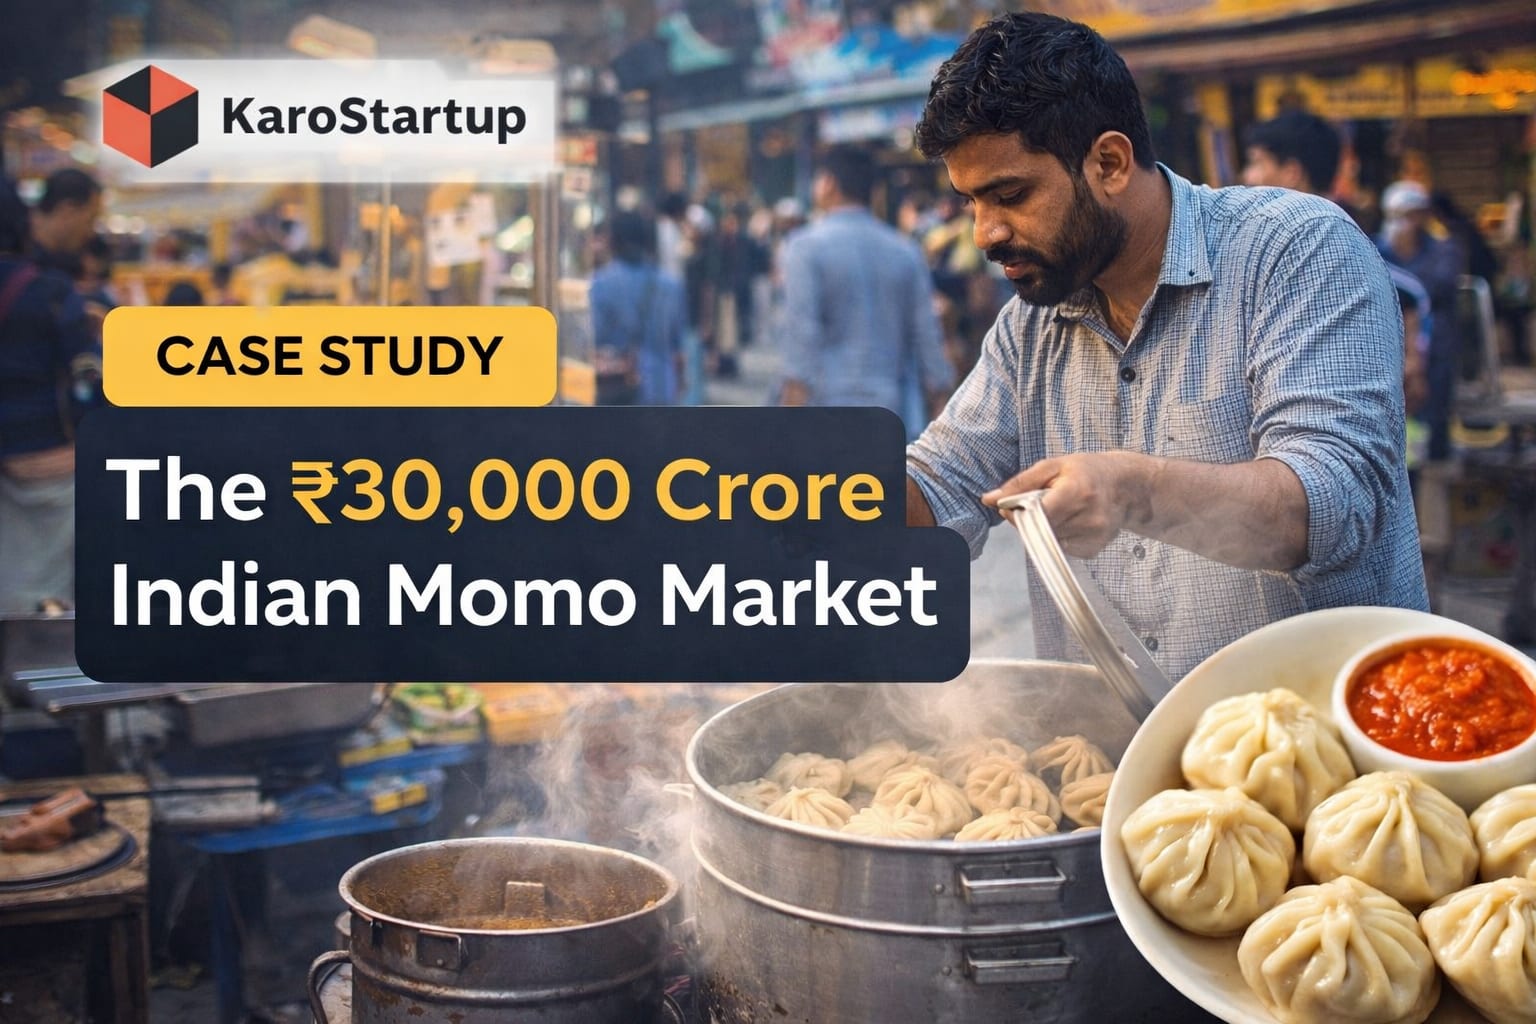
How Street Dumplings Became One of India’s Fastest-Growing Food Businesses
If you walk through Delhi University, Pune FC Road, Bengaluru tech parks, or a Tier-2 railway station market at 6 PM, you’ll see the same thing: steam rising from aluminium pots, red chutney in steel bowls, and a line of customers waiting.
Momos are no longer just a snack.
They are a ₹30,000+ crore annual market in India.
And yet, 90% of it is still unorganised.
This is not just a food story.
This is a case study in distribution, branding, and formalising a street category.
1. The Origin: How Momos Entered India
Momos originated in Tibet and Nepal and entered India primarily through:
-
Tibetan refugee settlements (1960s onwards)
-
Darjeeling & Northeast India
-
Delhi’s Majnu Ka Tila and North Campus
-
Hill stations and border trade routes
For decades, momos were hyperlocal.
But two factors changed everything:
1️⃣ Urban Youth Culture
Cheap, filling, shareable food.
2️⃣ Street-to-Mall Migration
What started at ₹20 per plate moved into food courts at ₹120 per plate.
The category scaled because:
-
It is veg & non-veg adaptable
-
Low raw material cost
-
Fast cooking cycle
-
Works in both street carts and QSR chains
2. How Big Is the Indian Momo Market?
| Segment | Market Size | Nature |
|---|---|---|
| Total Momo Market | ₹30,000+ crore annually | Mostly unorganised |
| Organised Segment | ~₹3,000 crore | QSR, frozen FMCG, B2B |
👉 Nearly 90% of the market is still street-driven and informal.
3. How Many Momos Are Eaten Per Day in India?
There is no official audited number.
But we can derive a transparent estimate.
Back-of-Envelope Calculation
If annual market ≈ ₹30,000 crore
Assume average realised price per momo = ₹12–₹15
Annual pieces ≈
₹30,000 crore ÷ ₹12 = 2,500 crore pieces per year
Per day ≈
5 to 7 crore momo pieces daily
Estimated Daily Consumption
Average Price / Piece ₹12–₹15
----------------------------------
Estimated Pieces / Day 5–7 Crore
That is comparable to India’s burger or pizza volume — without multinational dominance.
4. Organised Players & Their Scale
Wow! Momo
-
450–650+ stores
-
~1.2 million pieces sold per day
-
FY revenue ~₹480 crore
-
Valuation ~₹2,500 crore
-
Target: ₹1,000 crore revenue
-
Investing ₹35 crore in 1 million/day production facility
Wow! Momo formalised the category by:
-
Mall penetration
-
Centralised kitchens
-
Brand positioning as youth QSR
-
Expanding into Wow! China & Wow! Chicken
Prasuma (Frozen FMCG)
-
~100 million pieces per year
-
Retail + Modern trade + E-commerce
-
Focus on premiumisation
This signals a second wave:
From fresh QSR → to frozen retail distribution.
5. Revenue & Profit Margins
Let’s break this down.
Street Vendor Model
Example:
-
Selling price per plate (6 pieces): ₹40–₹60
-
Raw material cost per plate: ₹15–₹20
-
Gross margin: 50–60%
-
No rent (or minimal)
-
Daily sales: ₹5,000–₹12,000 possible
Monthly profit (good location): ₹40,000–₹1.2 lakh
Capital required: ₹50,000–₹2 lakh
This is why the category exploded.
QSR Model (Organised)
Average price per plate: ₹120–₹180
Food cost: 35–45%
Rent: 12–18%
Staff: 10–15%
Marketing: 5–10%
Net EBITDA margin: 12–20% (if scale is achieved)
The key here is centralised production.
Without supply chain control, margins collapse.
6. Why Momos Became Scalable
Unlike chaat or dosa, momos:
-
Can be frozen
-
Standardised easily
-
Have long shelf stability (compared to many street foods)
-
Adapt across cuisines (Tandoori, Cheese, Schezwan, Butter Chicken)
It behaves like:
A desi pizza in pocket format.
7. The Organised vs Unorganised Gap
Current Structure
| Category | Share |
|---|---|
| Unorganised Street | ~90% |
| Organised QSR/Frozen | ~10% |
This means the real opportunity lies in:
-
Supply chain formalisation
-
Frozen distribution
-
Cloud kitchens
-
Tier-2 & Tier-3 branding
8. What Entrepreneurs Can Still Build
The momo story is not over.
Here’s what is still untapped:
1️⃣ Regional Branding
There is no dominant national momo brand.
Unlike Domino’s in pizza.
India is still fragmented.
2️⃣ Frozen Export Opportunity
Indian diaspora demand for:
-
Veg momos
-
Paneer momos
-
Butter chicken momos
Frozen exports could be massive.
3️⃣ Health & Premiumisation
-
Millet wrappers
-
Gluten-free
-
High-protein variants
-
Vegan plant-based
Nobody owns the premium health momo space yet.
4️⃣ Franchise Aggregation Model
Instead of building 1,000 stores,
build supply chain + branding for 5,000 street vendors.
White-label mass scale.
5️⃣ Automation & Manufacturing
Industrial momo lines are underdeveloped.
A ₹30,000 crore market
needs large-scale food-tech automation players.
9. Risk Factors in the Industry
No case study is complete without risks.
⚠️ Low Entry Barrier
Anyone can start a cart.
⚠️ Brand Loyalty Is Weak
Consumers shift easily.
⚠️ Raw Material Inflation
Maida, chicken, oil price volatility.
⚠️ FSSAI & Compliance
Unorganised vendors are under regulatory pressure.
10. Why This Category Is Strategic
Momos are not just a snack.
They represent:
-
Street-to-brand formalisation
-
Bharat consumption story
-
Youth-driven food behaviour
-
Fast SKU scalability
It’s a blueprint for how Indian street food can scale nationally.
11. Infographic Summary
📊 Momo Market Snapshot
Total Market Value ₹30,000+ Cr
Organised Segment ₹3,000 Cr
Estimated Pieces / Day 5–7 Crore
Top Brand Revenue ₹480+ Cr
Street Vendor Margin 50–60%
QSR EBITDA Margin 12–20%
12. The Bigger Startup Lesson
Momos teach us three startup lessons:
1️⃣ Distribution > Innovation
Product was already there.
Execution created value.
2️⃣ Branding Multiplies Margins
₹40 plate → ₹160 plate
Same product, different positioning.
3️⃣ Formalisation Is the Next Goldmine
India’s next 100 brands will come from organising informal sectors.
13. Final Thought
India eats 5–7 crore momos per day.
Yet we have:
-
No dominant national monopoly
-
No global export giant
-
No listed momo company
-
No billion-dollar food-tech deep integration
This category is still in early innings.
The momo market isn’t saturated.
It’s fragmented.
And in India, fragmentation is opportunity.